Hohoho, the new kankuru version is available. I think it will be my last commit in 2017. In this version, you’ll find new tools (Statistics, Live Io Profile), minor improvements and some bug fix.
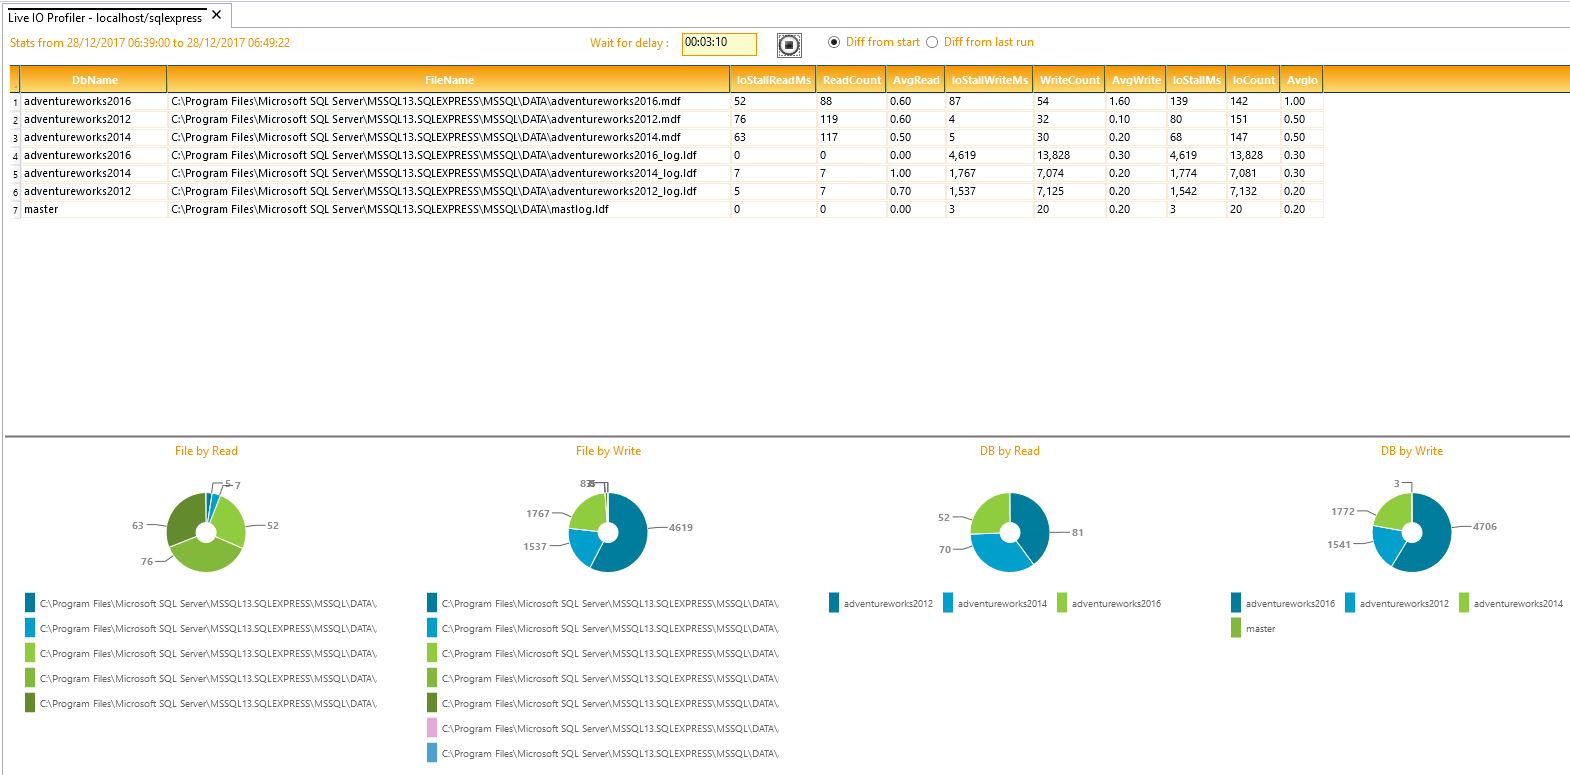
Live IO Profiler
I don’t know if you saw it but I added a forum to be able to speak easily with you. Frederic used it to propose me this new tool. He’s actually working on disk benchmark and wanted to check difference in SQL Server.
I use the DMV dm_io_virtual_file_stats to get io statistics by file and I calculate a diff between two executions.
You can find the query in KMO in the method GetLiveIOProfiler of KServer.cs
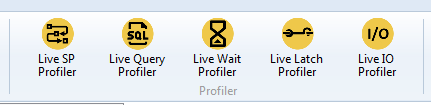
We now have 5 Live Profiler tools to check in live the performance of your server
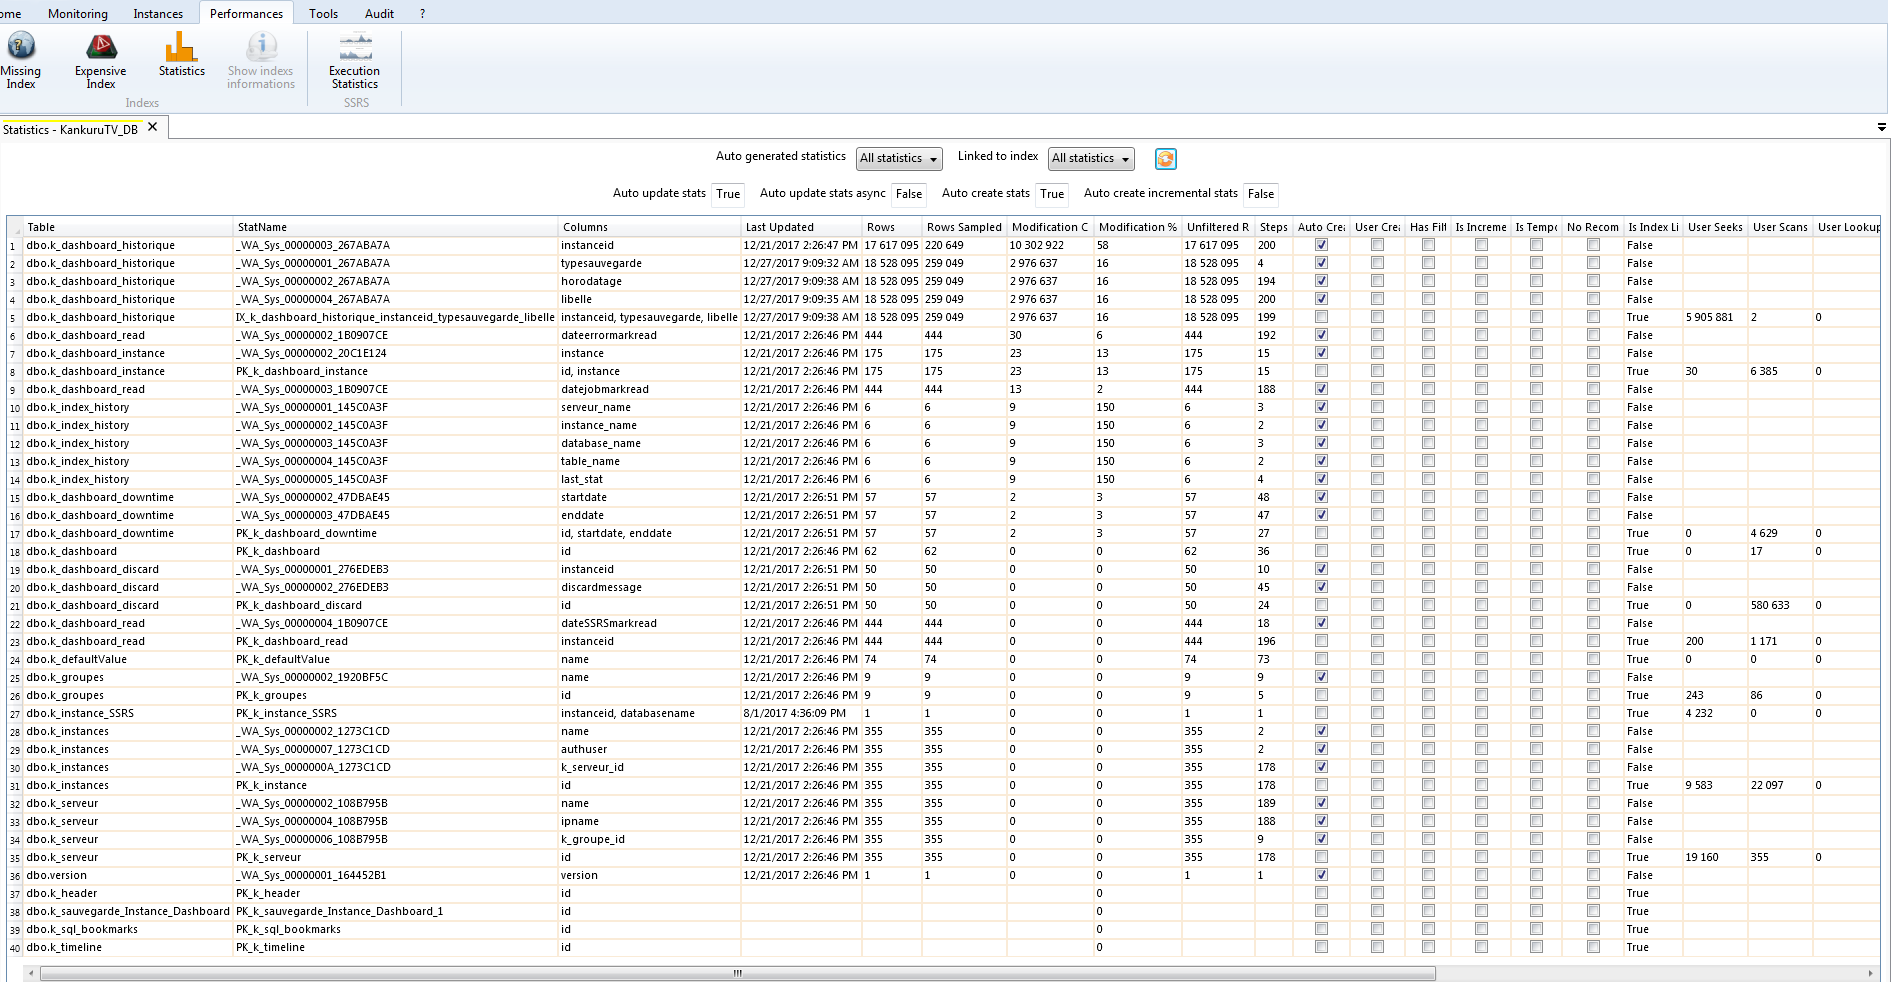
Statistics
Pass summit 2017 looks already far but I remembered one of our discussion with Christophe about statistics. He wanted to be able to check all statistics with the last update date, the modification counter, the linked index usage, etc…
I red this blog post and adapted the query to get all information we needed. This query is available in KMO.
Now, when you have a performance issue or a strange execution plan, just check if your statistics are up-to-date.
An anecdote about statistics : one of my previous colleague sent me an email because he didn’t understand why a query was executed in less than 1 second on production and 15 seconds on another server. He thought it was strange because the same query didn’t use the same execution plan. I told him to just run a sp_updatestats on its test environment and it resolved the issue. With this tool, he’ll be able to detect easily this problem.
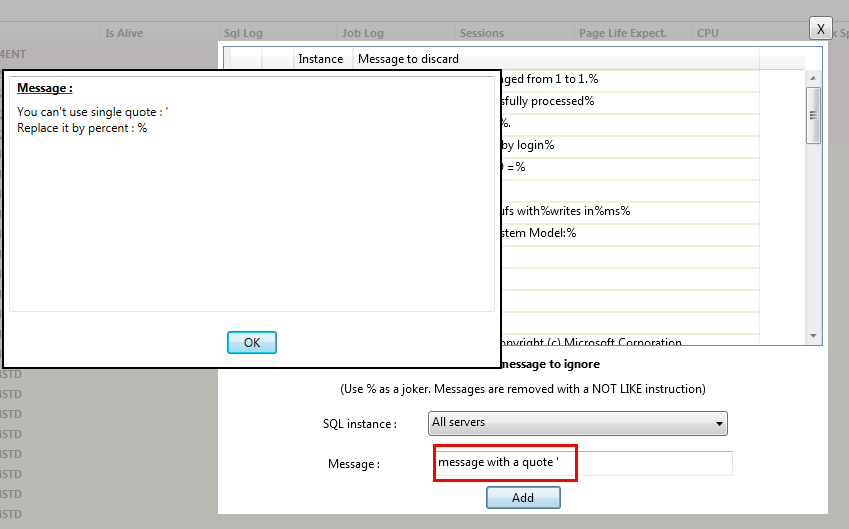
Ignore message
If you use Dashboard, I hope you know you can ignore some messages in error log, job log or session. There is a tool to manage messages to ignore. If you use a single quote in the message, it breaks the dashboard because I’m using these messages to build the filter clause of the query. I’m catching this problem. When you have a quote in the message you want to ignore, I propose to replace it by a percent.
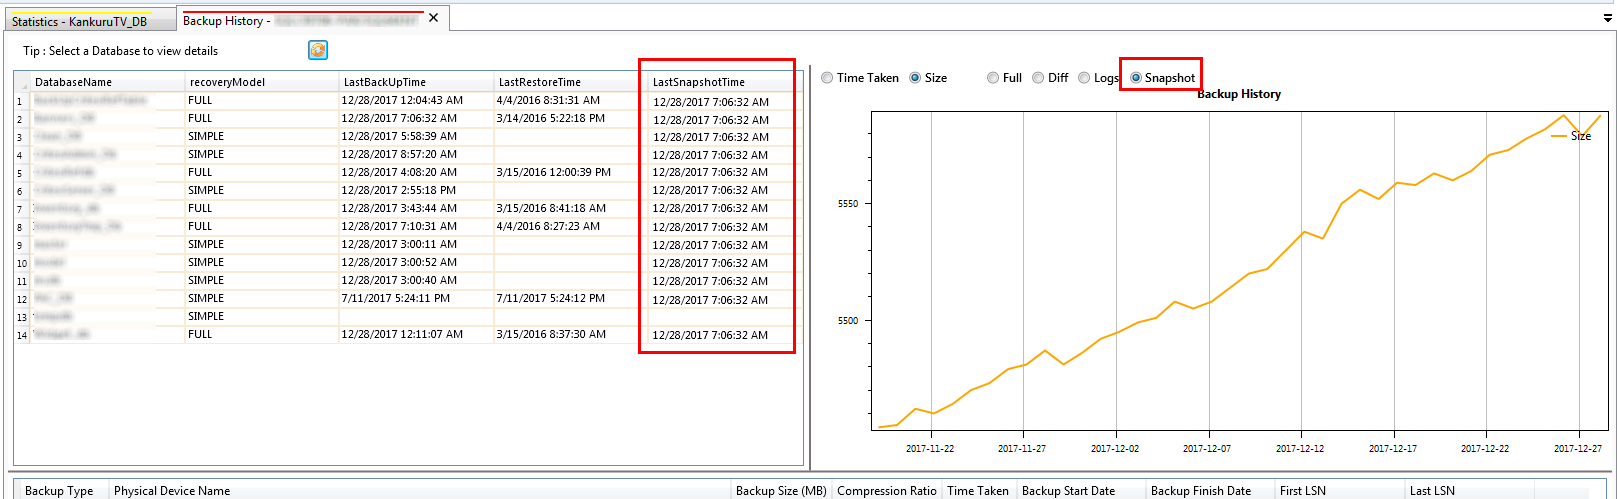
Snapshot in Backup History
Virtual machine snapshot is not my favorite backup method but if you have simple recovery model databases it can do the trick.
So I added a new column to get the last snapshot time. You can also check the time and the size evolution with the chart.
I updated the query in KMO.
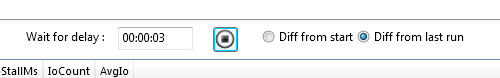
Live Profiler tools
There are now 2 mode in every live profiler tools.
Diff from start : it’s the default mode. It compares the last execution result with the first one.
Diff from last run : It compares the last execution result with the previous one
Thousand separator
To ease readability, I apply a thousand separator style in the custom Kankuru Datagrid.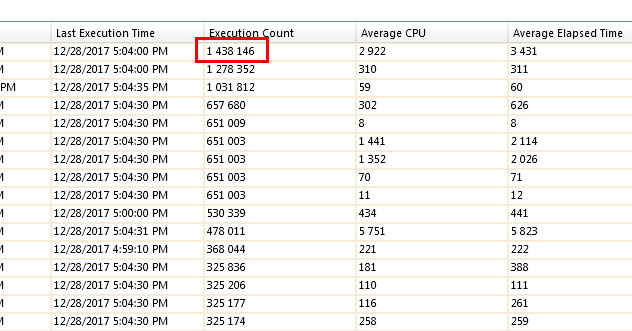
Kankuru Database
I’m starting to update the Kankuru database, using stored procedure instead of direct queries. I tested it on multiple environment but if you have an issue please contact me.
2017 Conclusion
In 2017, I released 6 new versions. I hope all these improvements helped you in your daily job. If you like Kankuru, share it on social networks, tell it to other sql server users and come in the forum to propose new ideas or ask for help.
Thank you for your support.
I wish you an happy new year.
Happy new bro and thanku for this article