It’s time to update Kankuru, a new version is available with new features and KMO integration. With KMO (Kankuru Management Objects), an open source library, Kankuru will become more open ! This is a major improvement, you’ll be able to contribute to Kankuru.
I also stop to provide setup files since you only need to copy files and execute KankuruWPF.exe to run Kankuru.
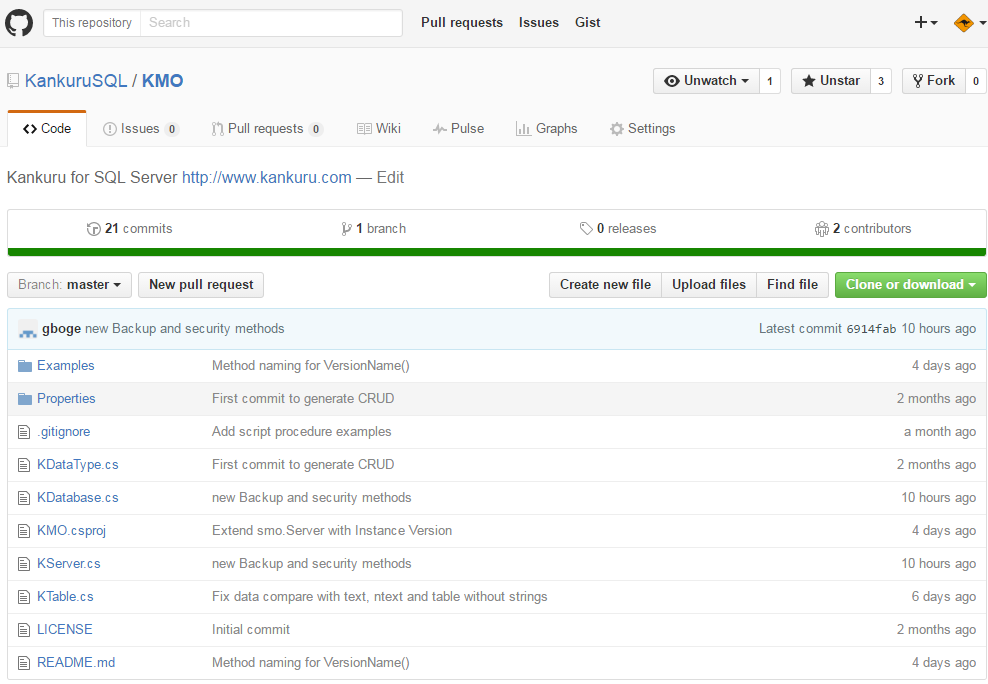
KMO
“Backup History” and “Who is SA” use now KMO to send queries to your SQL Server. Since KMO is open source, you’re now able to customize queries and merge improvements. In a near future, I’ll migrate a lot of queries in KMO instead of Kankuru !
Kankuru Replication monitor
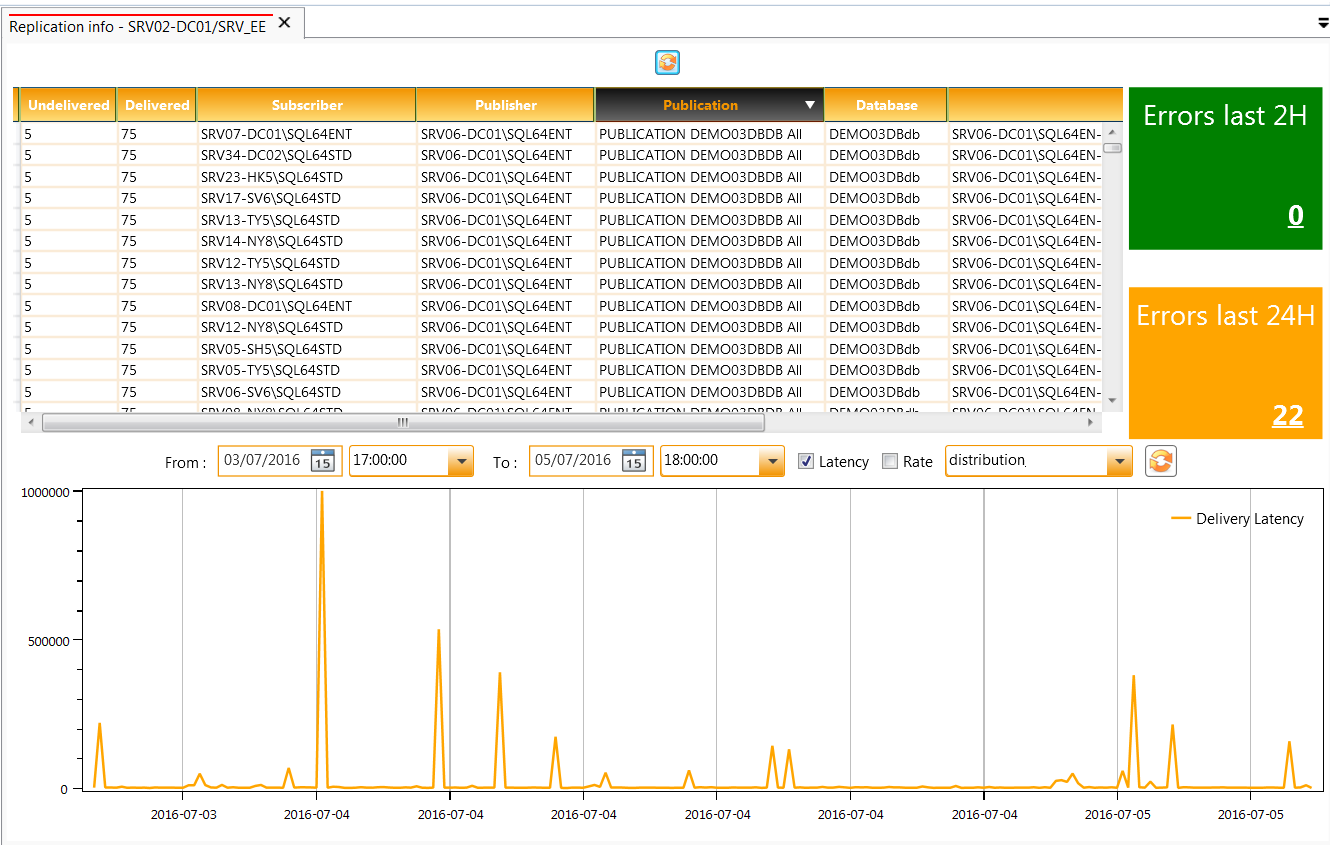
If you use Sql Server replication, you must know the replication monitor in SSMS. It’s useful but very expensive and sometime, we don’t see errors if the job is in retry. So I decided to create this tool. It’s very easy to use and can provide some statistics about your replication and error list. In this version, the screen is splitted in 3 zones :
- Latency per subscribers (commands replicated, commands to replicate)
- Errors in last 2-24 hours
- A chart to check latency and rate history
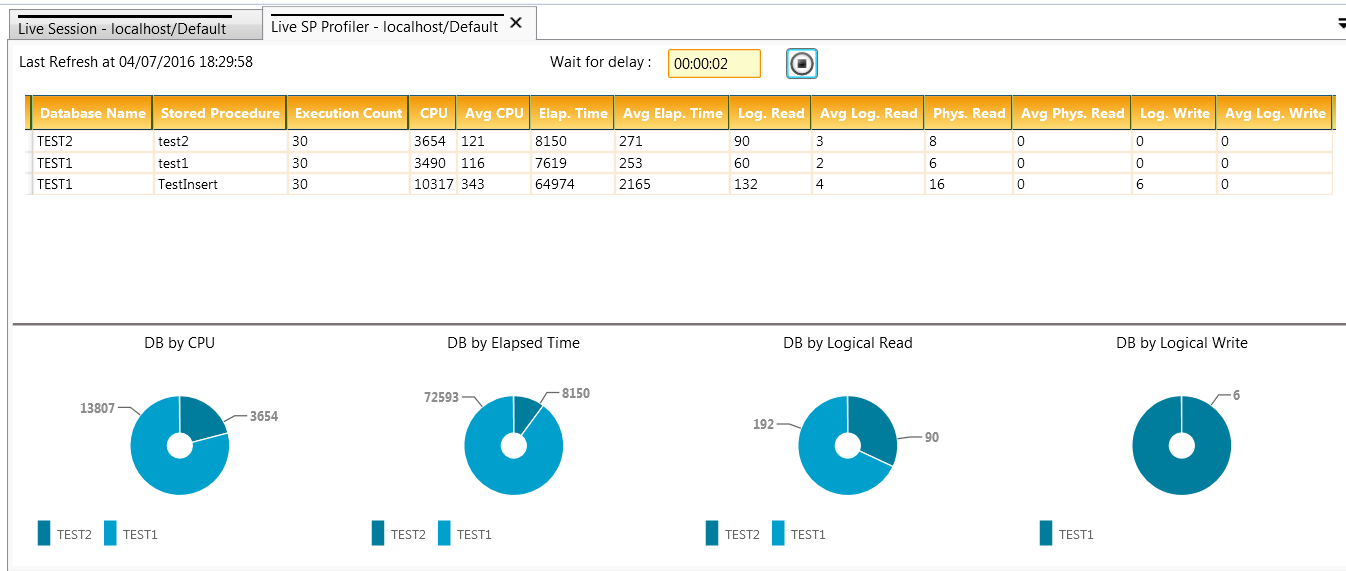
Live Stored Procedures profiler
In the version 1.2.7, I added this feature. With sys.dm_exec_procedure_stats, you were able to calculate procedures execution statistics. In the previous version, you had to wait for the delay expired to get the result. Now, you can check statistics in real-time. This is very easy to use and very powerful to detect expensive procedures.
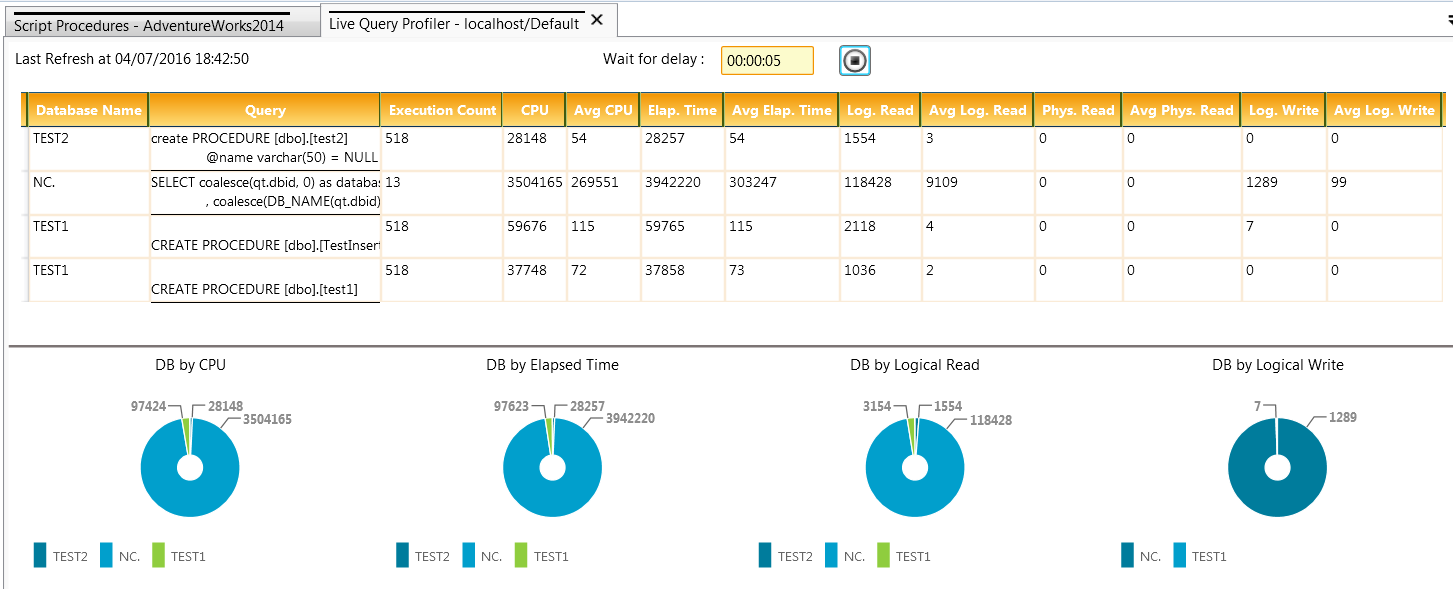
Live Query profiler
It works like Live SP profiler but it use sys.dm_exec_query_stats to catch every queries instead of procedures only. (More expensive in performance)
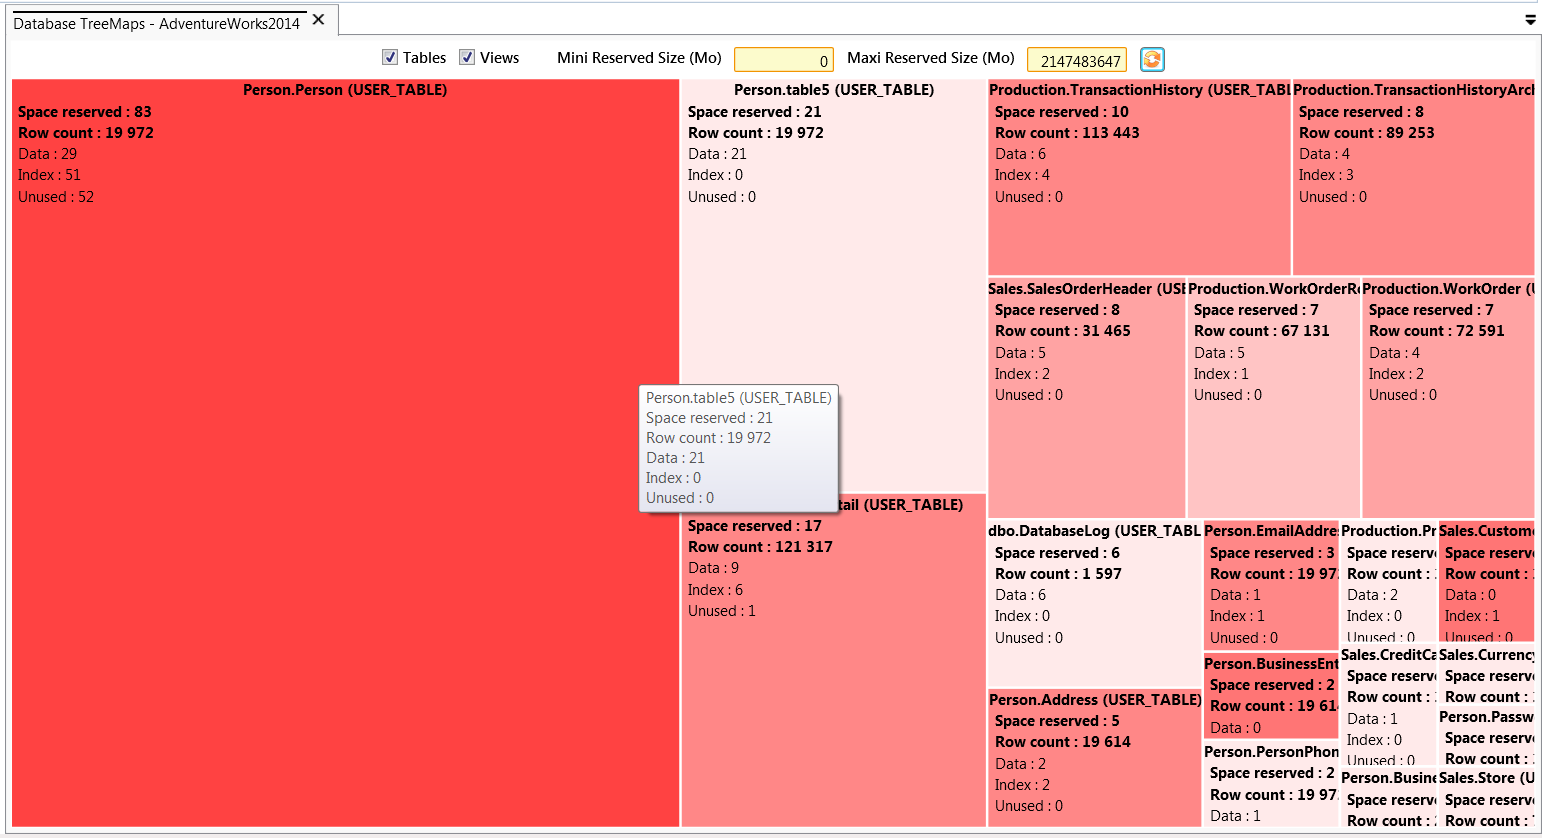
Database Treemaps
A treemap to know graphically which tables or views are the biggest.
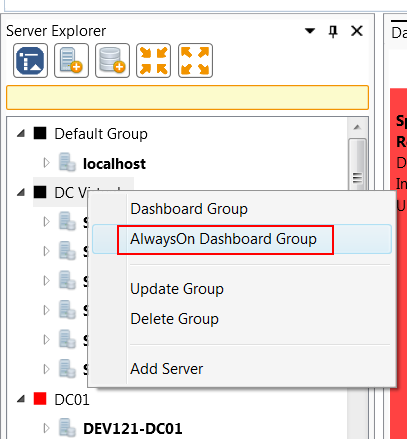
AlwaysOn Dashboard per Group
Actually, I have 170 servers configured in Kankuru but only 10 Availability Groups. When I try to open AlwaysOn Dashboard, it’s terribly slow because Kankuru scan all servers to find availability groups available. So with this version, I’m able to open directly the AlwaysOn Dashboard for a given group.
DB Compare
Now, I’m using KMO to compare data between 2 tables. So it should be more performant and you’re able to improve it since this is an opensource dll.
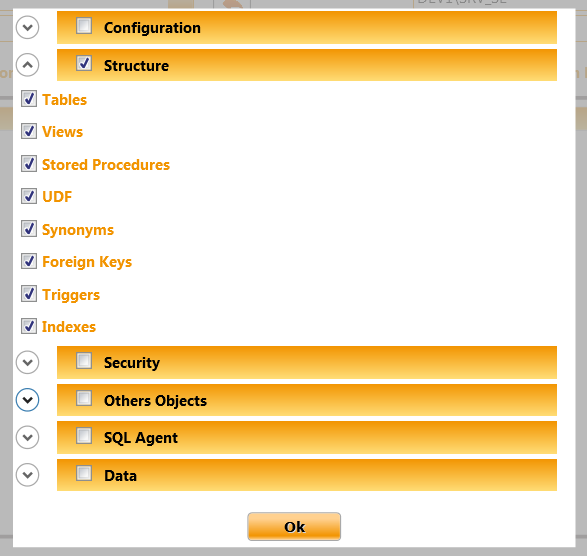
Another small improvement was to add these checkboxes.
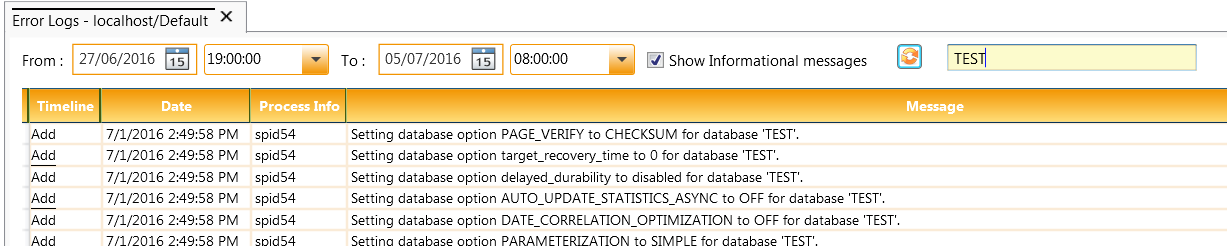
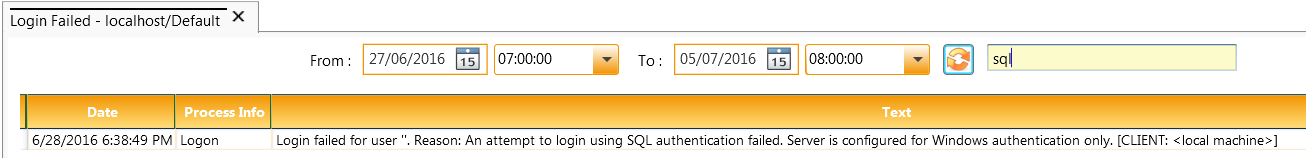
Error logs
You can now filter messages in errorlog with this new textbox. It’s filtered client-side.
Login Failed
I added the same parameters as error logs to filter dates and messages.
Treeview navigation
Using mouse to find a server can be boring ! Sometime, I just want to write the name of my server instead of search it. So now, you can search by server name and switch from search zone to treview with arrow.
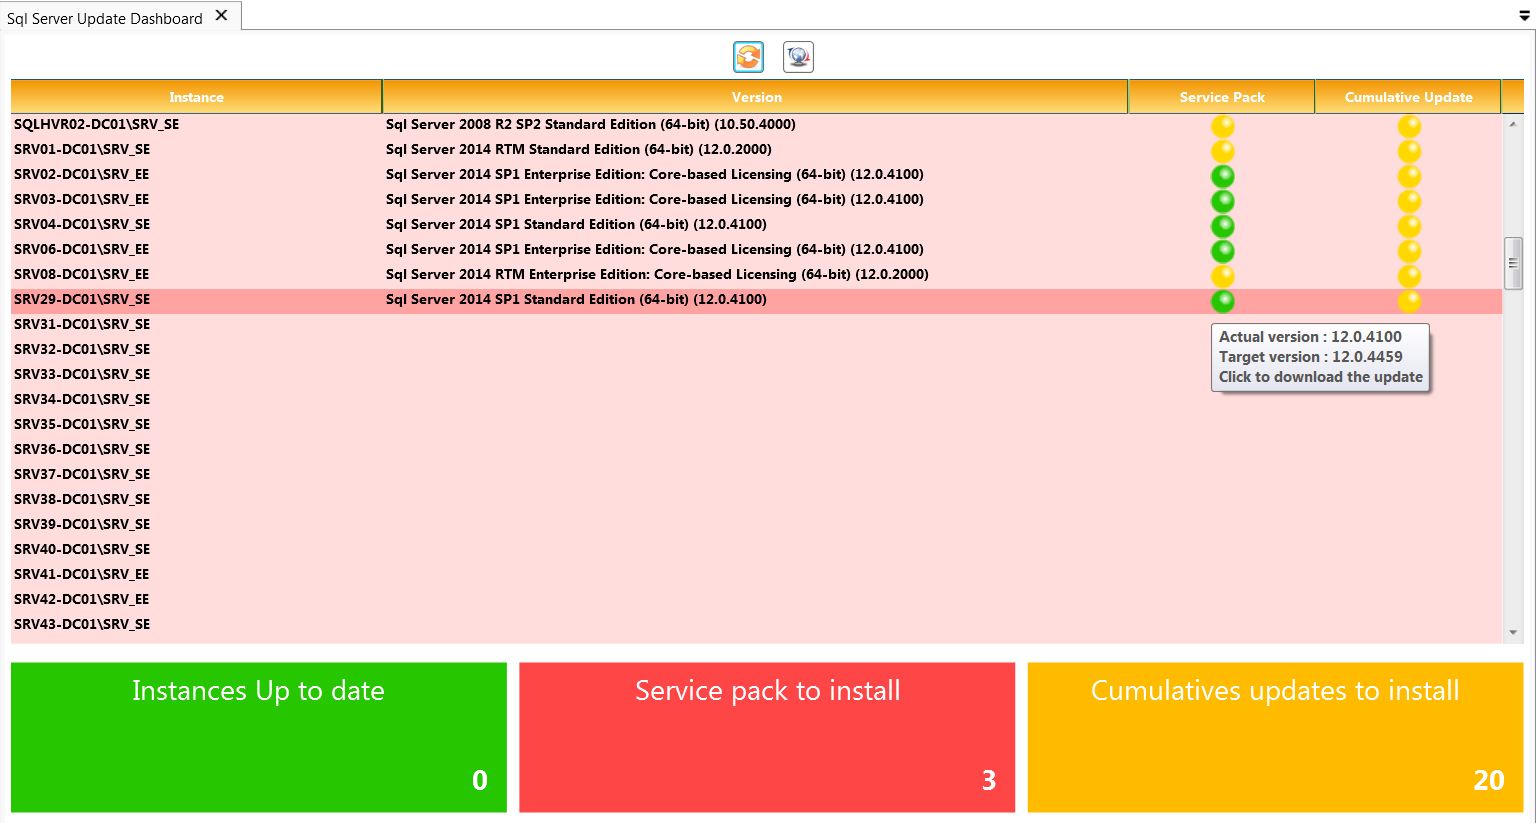
Update Dashboard
I updated Service Pack and Cumulative Updates signatures.
I also use KMO to get SQL Server Version Name
Kankuru Importer
This is another open source project to import SSMS registered servers to Kankuru. You can get it on github https://github.com/KankuruSQL/KankuruImporter
Enjoy and ping me if you have any question 🙂