Hello,
I didn’t release Kankuru for a while but the version 1.3.5 is now available. This new version improve the dashboard with replication, the possibility to ignore messages and many other fixes.
Replication in Dashboard
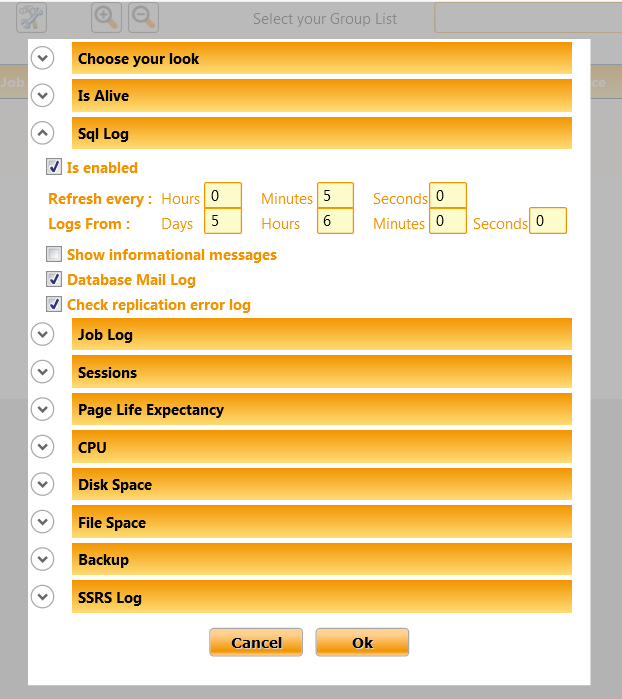
If you use replication, you should know it’s important to monitor the distribution log and if you use many publications it can be very difficult to monitor the platform. So in the column “SQL Error”, in addition of SQL Error Log and the Database Mail log, you can now activate the replication log.

By default, this option is disabled, you need to activate it in the dashboard configuration menu :

Discard bad messages
In the dashboard, you have alert in case of new message in error log and job log or session too long. But sometimes this is just normal and you prefer to ignore it. Now you can discard message using the table k_dashboard_discard. Actually, there is no GUI to manage it (maybe in the version 1.3.6). If the column instanceid is NULL then the filter will be apply to all instances.

Dashboard connection timeout
The connection timeout in Dashboard is now 6 second. It was 4 before. It’s useful if you want to monitor far servers.
Dashboard zoom
I fixed the bug with zoom buttons.

DASHBOARD CPU
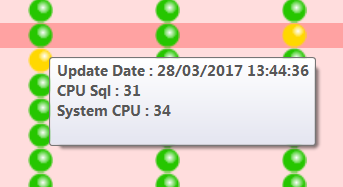
To have the average cpu usage in dashboard, I’m using the unsupported dmv dm_os_ring_buffers. There were a bug in the query, I fixed it.

ID Card
In the instance name, I added the netname in addition of servername.
I fixed a bug in Server Type with old sql server versions (Thanks Gregory)
I fixed a bug with services state (thanks Frederic)

Replication
At the first execution, the last hours was sometime unavailable. This bug is fixed.
Live SP profiler
I commited a fix in SMO to avoid an issue with procedure with multiple plan handle.
I also added the period of profiling and the capability to stop the load (like in Live Query Profiler)

Planning 2017
It’s not directly linked to Kankuru but I’m sure you’re also interested in the community.
In January, I spoke at MsCloudSummit about SQL Server continuous integration at Criteo. Slides are available here.
In march, I was invited to talk about Kankuru in the first Guss podcast. You can find it on soundcloud.
In June, I’ll speak about Powershell and SQL with the French Powershell User Group.
I’ll also try to speak in the next 24HOP and SQLSaturday…
Bonjour
Super application, impressionnant.
Juste une remarque sur le Dashboard AlwaysOn qui ne remonte que le groupe de disponibilité mais pas plus, dommage les screenshots donne envie.
Une flèche grise en bas à droite mais c’est tout.
Une idée du problème ?
Merci encore pour ce boulot
Bonjour,
Merci pour ce message 🙂
Si tu appuies sur ce bouton, il ne se passe rien ?

Et non, imagine ma frustration.
Côté réseau, je vois bien la requête initiale passer pour récupérer le nom du groupe de disponibilité, puis plus rien après, juste des keep alive.
je vais mettre à disposition une version spéciale pour essayer de comprendre d’où vient le problème. Je te contacterai demain par mail pour te donner plus de détail.
ok
merci