Instance Dashboard allows you to watch some performance counters without perfmon, in T-Sql only.
The data is collected with the method DashboardInstance in KServer.
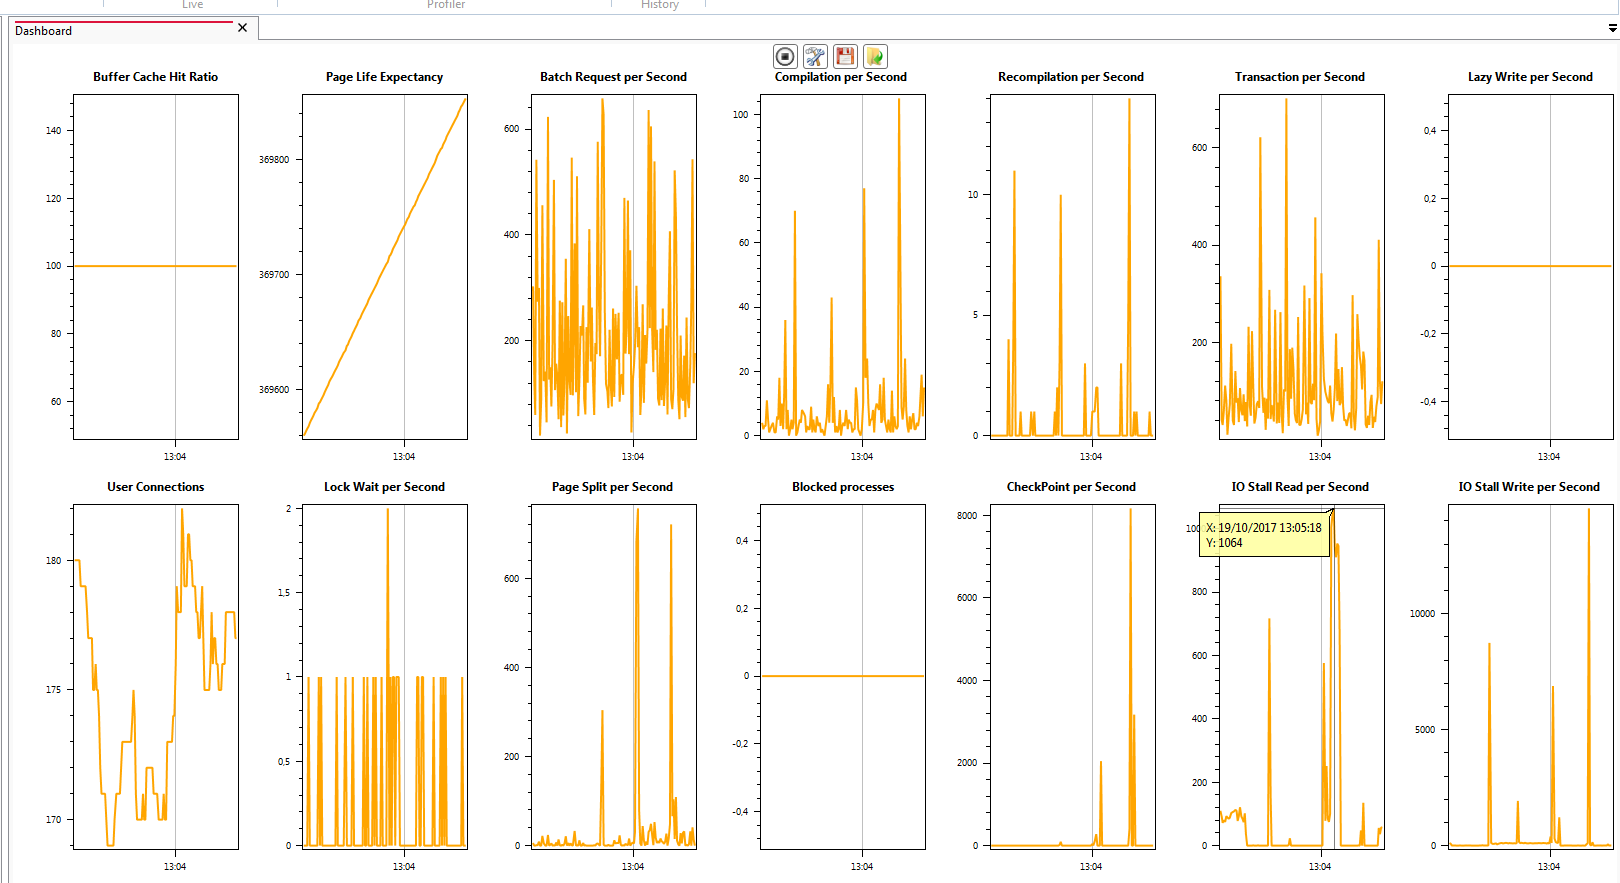
Available counters
Buffer Cache Hit Ratio
This counter comes from sys.dm_os_performance_counters
“Percentage of pages found in the buffer cache without having to read from disk. The ratio is the total number of cache hits divided by the total number of cache lookups over the last few thousand page accesses. After a long period of time, the ratio moves very little. Because reading from the cache is much less expensive than reading from disk, you want this ratio to be high. Generally, you can increase the buffer cache hit ratio by increasing the amount of memory available to SQL Server.” (source)
Page Life Expectancy (PLE)
This counter comes from sys.dm_os_performance_counters
“The definition of PLE is the expected time, in seconds, that a data file page read into the buffer pool (the in-memory cache of data files pages) will remain in memory before being pushed out of memory to make room for a different data file page. Another way to think of PLE is an instantaneous measure of the pressure on the buffer pool to make free space for pages being read from disk. For both of these definitions, a higher number is better.” (source)
Batch Request/sec
This counter comes from sys.dm_os_performance_counters
“Number of Transact-SQL command batches received per second. This statistic is affected by all constraints (such as I/O, number of users, cache size, complexity of requests, and so on). High batch requests mean good throughput.” (source)
Compilation/Sec
This counter comes from sys.dm_os_performance_counters
“Number of SQL compilations per second. Indicates the number of times the compile code path is entered. Includes compiles caused by statement-level recompilations in SQL Server. After SQL Server user activity is stable, this value reaches a steady state.” (source)
Recompilation/Sec
This counter comes from sys.dm_os_performance_counters
“Number of statement recompiles per second. Counts the number of times statement recompiles are triggered. Generally, you want the recompiles to be low.” (source)
Transaction/Sec
available in 1.4.2
This counter comes from sys.dm_os_performance_counters
“A transaction is a single unit of work. If a transaction is successful, all of the data modifications made during the transaction are committed and become a permanent part of the database. If a transaction encounters errors and must be canceled or rolled back, then all of the data modifications are erased.”(source)
Lazy Write/Sec
available in 1.4.2
This counter comes from sys.dm_os_performance_counters
“Indicates the number of buffers written per second by the buffer manager’s lazy writer. The lazy writer is a system process that flushes out batches of dirty, aged buffers (buffers that contain changes that must be written back to disk before the buffer can be reused for a different page) and makes them available to user processes. The lazy writer eliminates the need to perform frequent checkpoints in order to create available buffers.” (source)
User Connection
This counter comes from sys.dm_os_performance_counters
“The connection is the physical communication channel between SQL Server and the application: the TCP socket, the named pipe, the shared memory region.” (source)
Lock Wait/Sec
This counter comes from sys.dm_os_performance_counters
“Number of lock requests per second that required the caller to wait.” (source)
Page split/Sec
This counter comes from sys.dm_os_performance_counters
“This counter measures the number of times SQL Server had to split a page when updating or inserting data per second. Page splits are expensive, and cause your table to perform more poorly due to fragmentation. Therefore, the fewer page splits you have the better your system will perform. Ideally this counter should be less than 20% of the batch requests per second.” (source)
Blocked processes
This counter comes from sys.dm_os_performance_counters
“The processes blocked counter identifies the number of blocked processes. When one process is blocking another process, the blocked process cannot move forward with its execution plan until the resource that is causing it to wait is freed up. Ideally you don’t want to see any blocked processes. When processes are being blocked you should investigate.” (source)
Checkpoint/Sec
This counter comes from sys.dm_os_performance_counters
“Indicates the number of pages flushed to disk per second by a checkpoint or other operation that require all dirty pages to be flushed.” (source)
IO stall read/Sec
available in 1.4.2
This counter comes from sys.dm_io_virtual_file_stats(NULL, NULL)
“Total time, in milliseconds, that the users waited for reads issued on the file.” (source)
IO stall write/Sec
available in 1.4.2
This counter comes from sys.dm_io_virtual_file_stats(NULL, NULL)
“Total time, in milliseconds, that users waited for writes to be completed on the file.” (source)
Permissions
Instance Dashboard requires VIEW SERVER STATE permission
Configuration
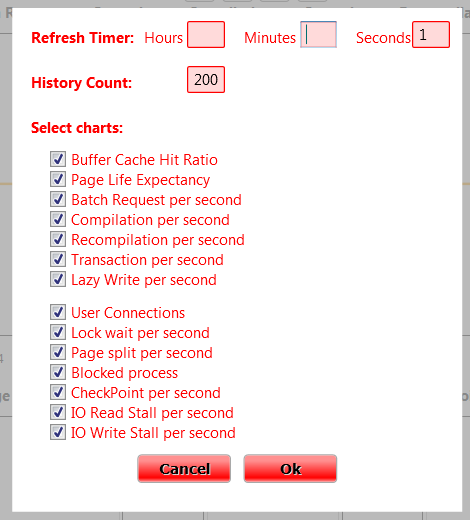
Refresh Timer
By default = 1 second. Time between 2 data refresh.
History Count
By default = 200. Maximum points in each chart. Increase this value if you want to have more history but it could decrease readability.
Select chart
available in 1.4.2
I recently added new charts, so it can decrease readability. So you can select which chart to show.
Note : all data are collected even if you don’t select a chart.
Save & load
You can save traces. They are inserted in the kankuru database as XML.