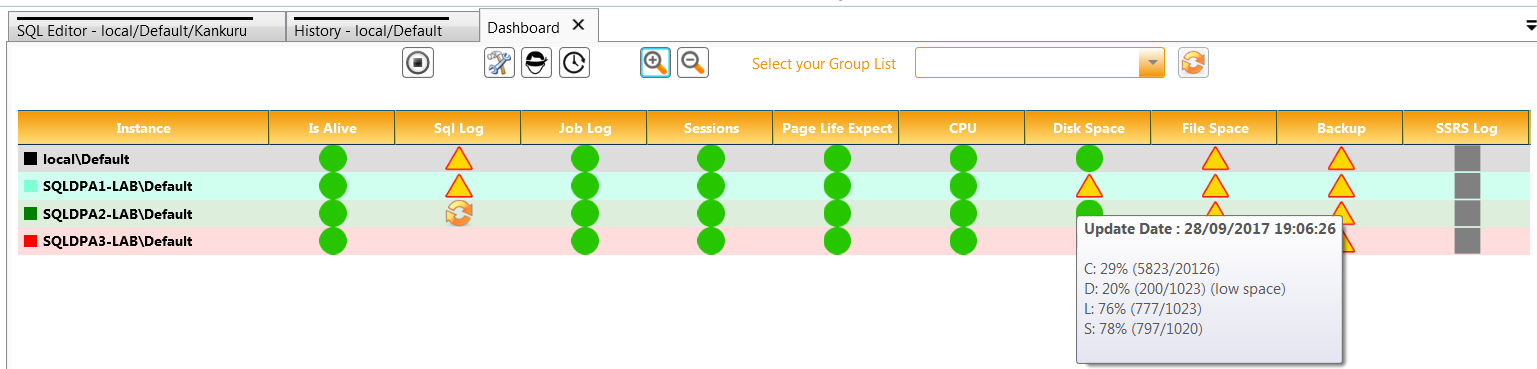
Dashboard is one of the most important tool in Kankuru. For each SQL Server instance, you’re able to monitor everything and to know if there is an issue on 1 server. You can check easily ping, sql errorlog, database mail errorlog, replication errorlog, Sql Agent log, sessions duration, locks, page life expectancy, cpu, disk space, file space and SSRS log. Kankuru dashboard is like Sauron eye, in one windows you can monitor hundreds of servers.
Of course, this dashboard is fully configurable. You can configure threshold, message to ignore, disable/enable checks for every server or just for a specific instance.
Dashboard Columns
IsAlive
This is just a simple query to check if the server is up. I think this check should be scheduled more often than other.
The query executed is available in the method DashboardIsAlive in KMO.
KMO Query : DashboardIsAlive in KServer.cs
Result
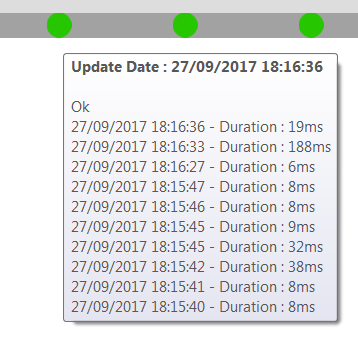
Green: the server is reachable
Red: Kankuru was not able to connect on your instance.
The icon tooltip shows the last execution result with execution elapsed time.
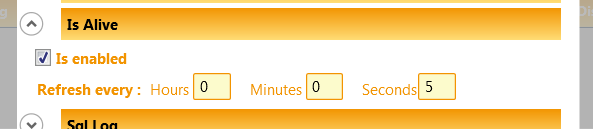
Configuration
Is Enabled: to enable or disable this rule
Refresh every: to define the schedule
Navigation
No navigation from this column, you can only refresh by double-clicking or right-clicking + refresh menu
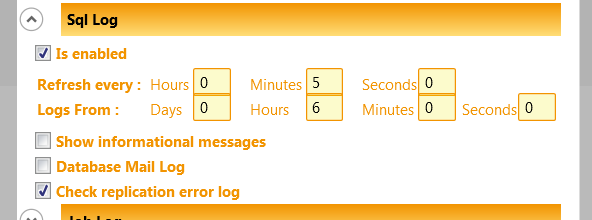
SQL Log
In this column, you can see every entries in Sql error log, databasemail error log and replication error log. Of course, you can decide to ignore some messages (read ignore message).
The query executed is available in the method DashboardErrorLog in KMO
You can mark as read errors by right clicking on the icon. You will only be alerted in case of new message.
KMO Query : DashboardErrorLog in KServer.cs
Result
Green: No new error message.
Yellow: At least 1 new message. Read the tooltip to see it
Red: Kankuru was not able to connect on your instance or there was a bug. Read the tooltip for more information.
The icon tooltip shows last messages (message already read are in gray)
Configuration
Is Enabled: to enable or disable this rule
Refresh every: to define the schedule
Logs from: Message older than (NOW – this parameter) will be ignored
Show Informationnal messages: if unchecked, informational messages will be ignored.
Informational message looks like ‘%This is an informational message%’, ‘%No user action required%’, ‘%DBCC CHECKDB%found 0 errors and repaired 0 errors%’
Database mail log: If checked, messages from msdb.dbo.sysmail_log will be include.
Check replication error log: If checked, messages from “every distribution database”.dbo.MSrepl_errors will be include.
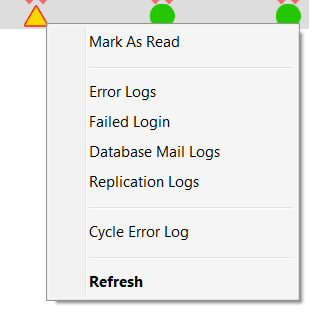
Navigation
Mark as Read : cf. dedicated paragraph
Error Logs : Open Sql Error Log
Failed Login : Open Login Failed
Database Mail Logs : Open Database Mail Log
Replication Logs : Open Replication tool
Cycle Error Log : Cycle the SQL Error Log with the procedure sp_cycle_errorlog. Warning! This is a direct action on your server.
Refresh : Refresh the point
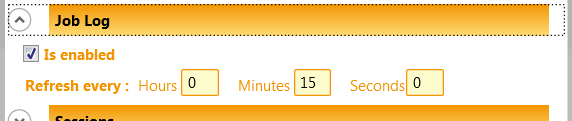
Job Log
You can check in this column all job execution failure of the day from the SQL Agent.
KMO Query : DashboardJob in KServer.cs
Result
Green: No new error message.
Yellow: At least 1 new message. Read the tooltip to see it
Red: Kankuru was not able to connect on your instance or there was a bug. Read the tooltip for more information.
The icon tooltip shows last messages (message already read are in gray)
Configuration
Is Enabled: to enable or disable this rule
Refresh every: to define the schedule
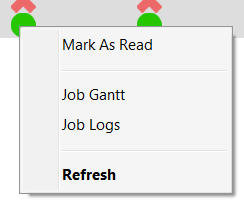
Navigation
Mark as Read : cf. dedicated paragraph
Job Gantt : Open Job Gantt
Job Logs : Open Job logs
Refresh : Refresh the point
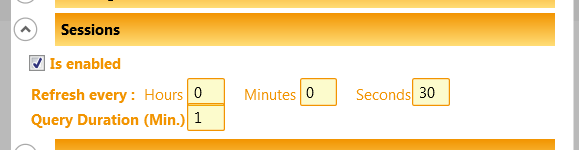
Sessions
Detect all session during more than X minutes (X is configurable)
KMO Query : DashboardGetLocks in KServer.cs
Result
Green: No session detected
Yellow: At least 1 session found. Read the tooltip to see it
Red: Kankuru was not able to connect on your instance or there was a bug. Read the tooltip for more information.
The icon tooltip shows active sessions
Configuration
Is Enabled: to enable or disable this rule
Refresh every: to define the schedule
Query duration in Minute : the threshold in minute
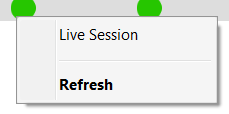
Navigation
Live Session : Open the tool Live Session
Refresh : Refresh the point
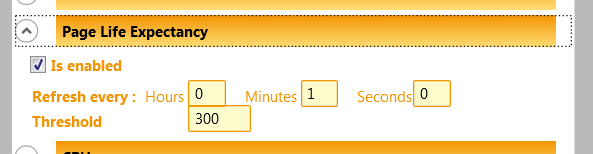
Page Life Expectancy (PLE)
PLE is the time a page stays in memory so it’s a good performance counter to check. With this counter, we can detect memory pressures.
KMO Query : DashboardPle in KServer.cs
Result
Green: PLE greater than threshold
Yellow: PLE lower than threshold. By default, this threshold = 300 seconds. You should configure it manually for each instance. IMHO, I think this formula is good to find the good threshold : “Maximum Server Memory of the instance in GB” / 4 * 300
Red: Kankuru was not able to connect on your instance or there was a bug. Read the tooltip for more information.
The icon tooltip shows the last PLE
Configuration
Is Enabled: to enable or disable this rule
Refresh every: to define the schedule
Threshold: the threshold in second
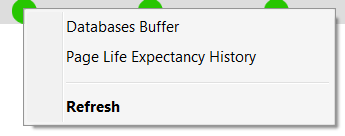
Navigation
Databases Buffer: Open Databases Buffer
Page Life Expectancy History: Open the history tool
Refresh : Refresh the point
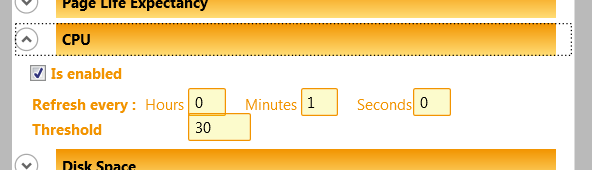
CPU
Get the average System CPU and the average Sql CPU of the last 30 minutes.
KMO Query : DashboardCpu in KServer.cs
Result
Green: System CPU lower than threshold
Yellow: System CPU greater than threshold. By default, this threshold = 30%. You should configure it manually for each instance depending of your workload.
Red: Kankuru was not able to connect on your instance or there was a bug. Read the tooltip for more information.
The icon tooltip shows the last average System CPU and the last average Sql CPU of the last 30 minutes
Configuration
Is Enabled: to enable or disable this rule
Refresh every: to define the schedule
Threshold : the threshold in percent
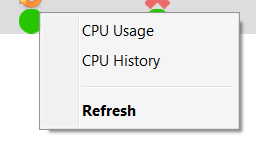
Navigation
CPU Usage : open the database CPU Usage
CPU History : open the history tool
Refresh : Refresh the point
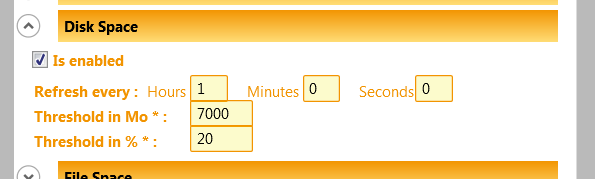
Disk Space
Check the free disk space. If “Ole Automation Procedures” option is enabled on your instance (by default no), Kankuru is able to calculate the free disk space in percent. If this option is disabled, you’ll only be able to get the free disk space in MB.
To enable this option, you can execute this query on your instance (but read the doc before!) :
sp_configure 'show advanced options', 1
GO
RECONFIGURE
GO
sp_configure 'Ole Automation Procedures', 1
GO
RECONFIGURE
GO
KMO Query : DashboardDisk in KServer.cs
Result
Green: Free disk space is greater than the threshold
Yellow: Free disk space is lower than the threshold
Red: Kankuru was not able to connect on your instance or there was a bug. Read the tooltip for more information.
The icon tooltip shows the free disk space.
Configuration
Is Enabled: to enable or disable this rule
Refresh every: to define the schedule
Threshold in MB: Threshold in MB. Only used if you didn’t activate “Ole Automation Procedures” on your instance.
Threshold in %: Threshold of free logical disk space in percent
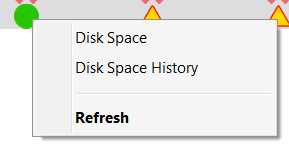
Navigation
Disk Space: Open disk space
Disk Space History: Open the tool History
Refresh : Refresh the point
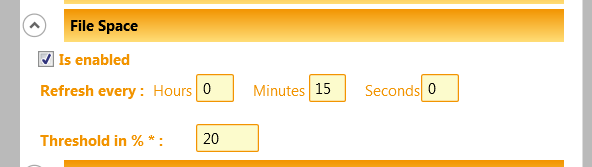
File Space
Check the size available in your data or log files.
KMO Query : DashboardFiles in KServer.cs
Result
Green: Free size in all files are greater than the threshold
Yellow: Free size of at least 1 file is lower than the threshold
Red: Kankuru was not able to connect on your instance or there was a bug. Read the tooltip for more information.
The icon tooltip shows
Configuration
Is Enabled: to enable or disable this rule
Refresh every: to define the schedule
Threshold : Threshold in percent of free size
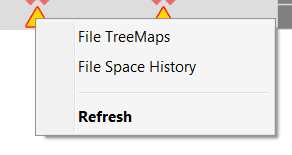
Navigation
File TreeMaps: Open File TreeMaps
File Space History: Open History
Refresh : Refresh the point
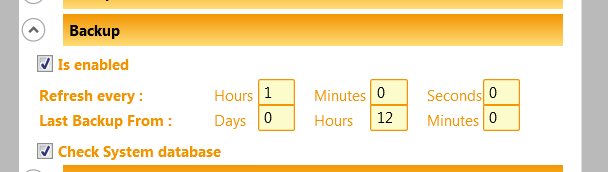
Backup
Check if you backup all your databases
KMO Query : DashboardBackup in KServer.cs
Result
Green: All your databases are backup
Yellow: At least 1 database was not correctly backup
Red: Kankuru was not able to connect on your instance or there was a bug. Read the tooltip for more information.
The icon tooltip shows list of database not backup during the last hours with their last backup date
Configuration
Is Enabled: to enable or disable this rule
Refresh every: to define the schedule
Last Backup From : to define the maximum delay between 2 backups
Check System Database : if you want check backup of your system databases (master, msdb, model)
Navigation
Backup History : Open Backup History
Refresh : Refresh the point

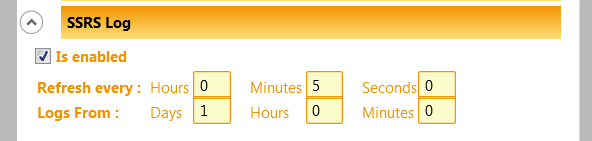
SSRS Log
Check the error log of your reporting services.
To be available, you must activate this feature in the Server Explorer (left pane) by right-clicking on your instance and clicking on the menu “Activate SSRS Monitoring”. You’ll have to define which are the reporting services databases.
KMO Query : DashboardSsrs in KDatabase.cs
Result
Green: no error detected in the SSRS execution log
Yellow: at least 1 error detected in the SSRS execution log
Red: Kankuru was not able to connect on your instance or there was a bug. Read the tooltip for more information.
The icon tooltip shows the list of the last errors detected
Configuration
Is Enabled: to enable or disable this rule
Refresh every: to define the schedule
Logs from: Message older than (NOW – this parameter) will be ignored
Navigation
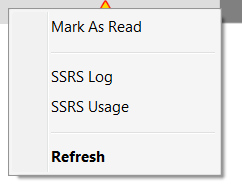
Mark as Read : cf. dedicated paragraph
SSRS Log: Open SSRS Log
SSRS Usage: Open SSRS Usage
Refresh : Refresh the point
Actions
Ignore message
It’s great to get warning for all the sql platform but we don’t want to see every messages. For exemple, some successful backup are written in the sql error log or I know some queries are longer than the threshold and I don’t want to get warning on these queries.
So there is a tool to define which messages will be ignored.
You can define a message for every servers or for a specific instance.
Be careful, I use these messages to generate a dynamic SQL query. All these messages will be used in a query “NOT LIKE ‘%TheMessage%'”
So you can use % as a joker but don’t use simple quotes “‘”.
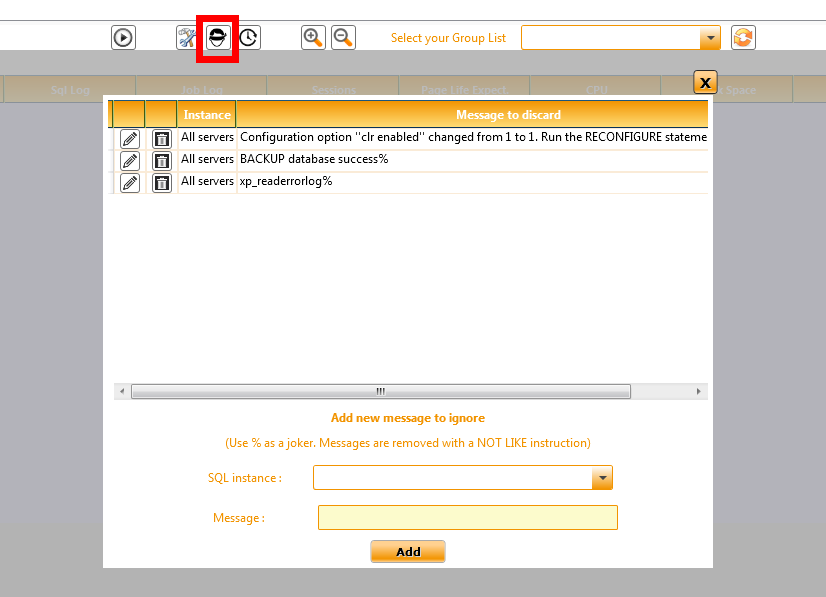
I propose you this script to ignore some messages.
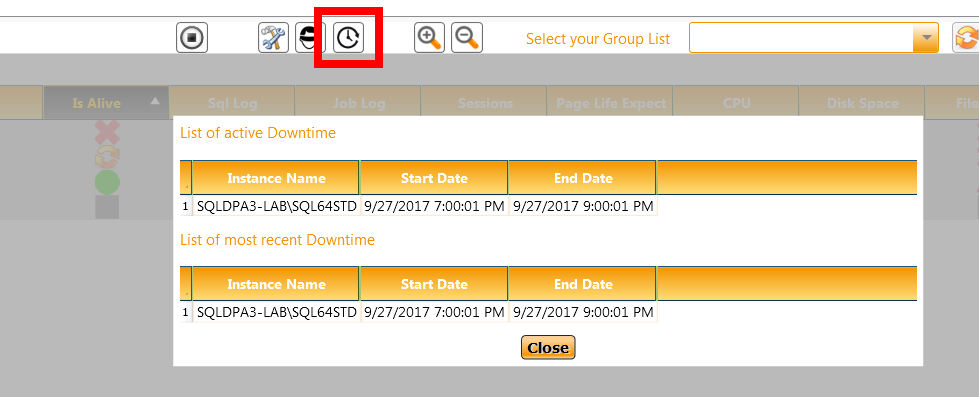
Downtime
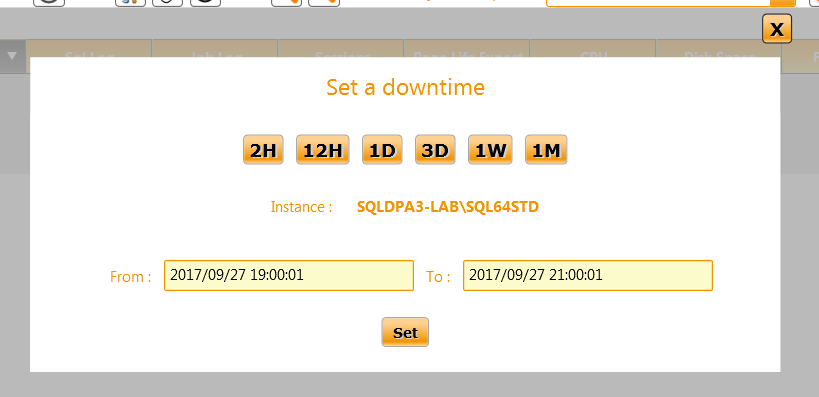
Sometimes we need to stop a server for maintenance purpose and we don’t want to receive alerts. You can downtime the server for a given period.
You just need to right click on the server name
 And to select the period of downtime
 The server icons are grey and Kankuru doesn’t try to send it queries (in case of auto-collapse option, the line is invisible)
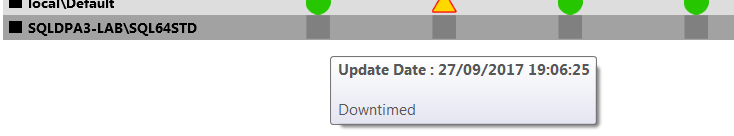
you can get the list of downtimed instance by clicking on this button
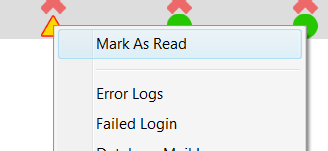
Mark as read
In Sql Log, Job Log and SSRS Log, you can mark as read messages by right clicking on the point + “Mark as Read”.
Previous warning message will still be available in the tooltip but the icon will become green.
Zoom
If you have a monitoring TV with the Dashboard, you could want to increase (or reduce) the size of each lines. Use these buttons to change the Dashboard row size.

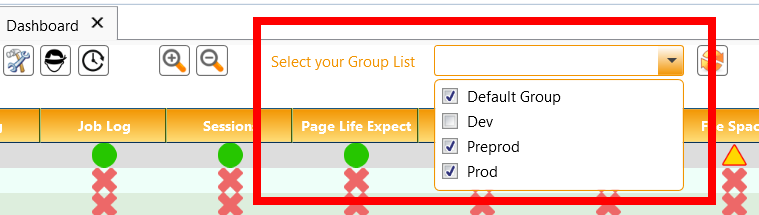
Groups
You can filter server groups directly in the Dashboard.
NB : First, you need to stop the Dashboard, select groups and refresh the Dashboard before restarting it.
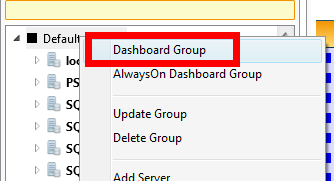
Dashboard group
In the server explorer (left pane), you can start the Dashboard for a specific group.
Options
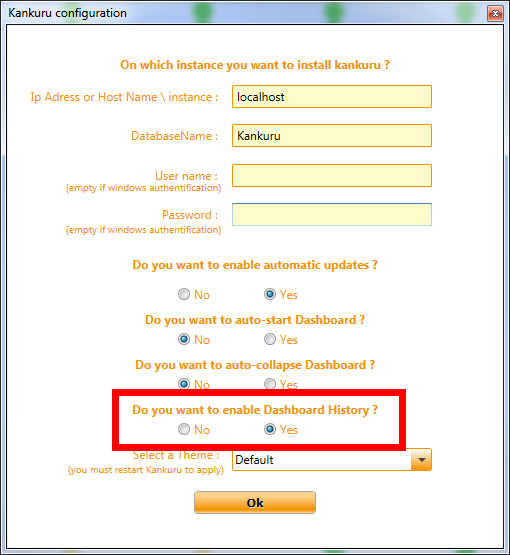
History
If you enable this feature (by default), the Dashboard will store in the table k_dashboard_historique some data (cpu, disk size, file size, Page Life Expectancy).
You can watch history for a specific server in the tool history.
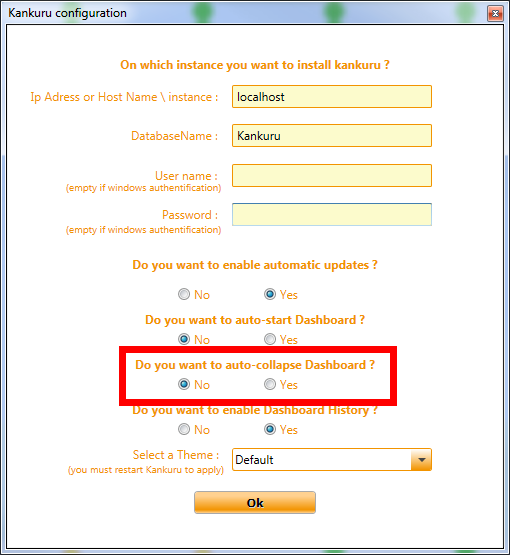
Auto-collapse
This feature is disabled by default. If you enable it, you’ll only watch in the Dashboard the rows with error or warning. If all icons of a line are green or grey, the line will be hidden.
Very useful if you have a lot of instances to monitor.
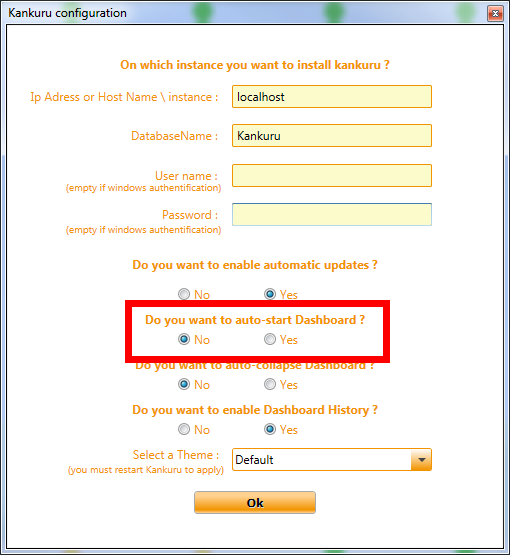
Auto-start
If you enable this option, the Dashboard will start when you’ll execute Kankuru. By default, this feature is disabled.